3Q26 Research Charts & Visuals Gallery
All charts are generated directly from primary corporate filings, SEC XBRL tables, and Federal Reserve / U.S. Treasury releases.
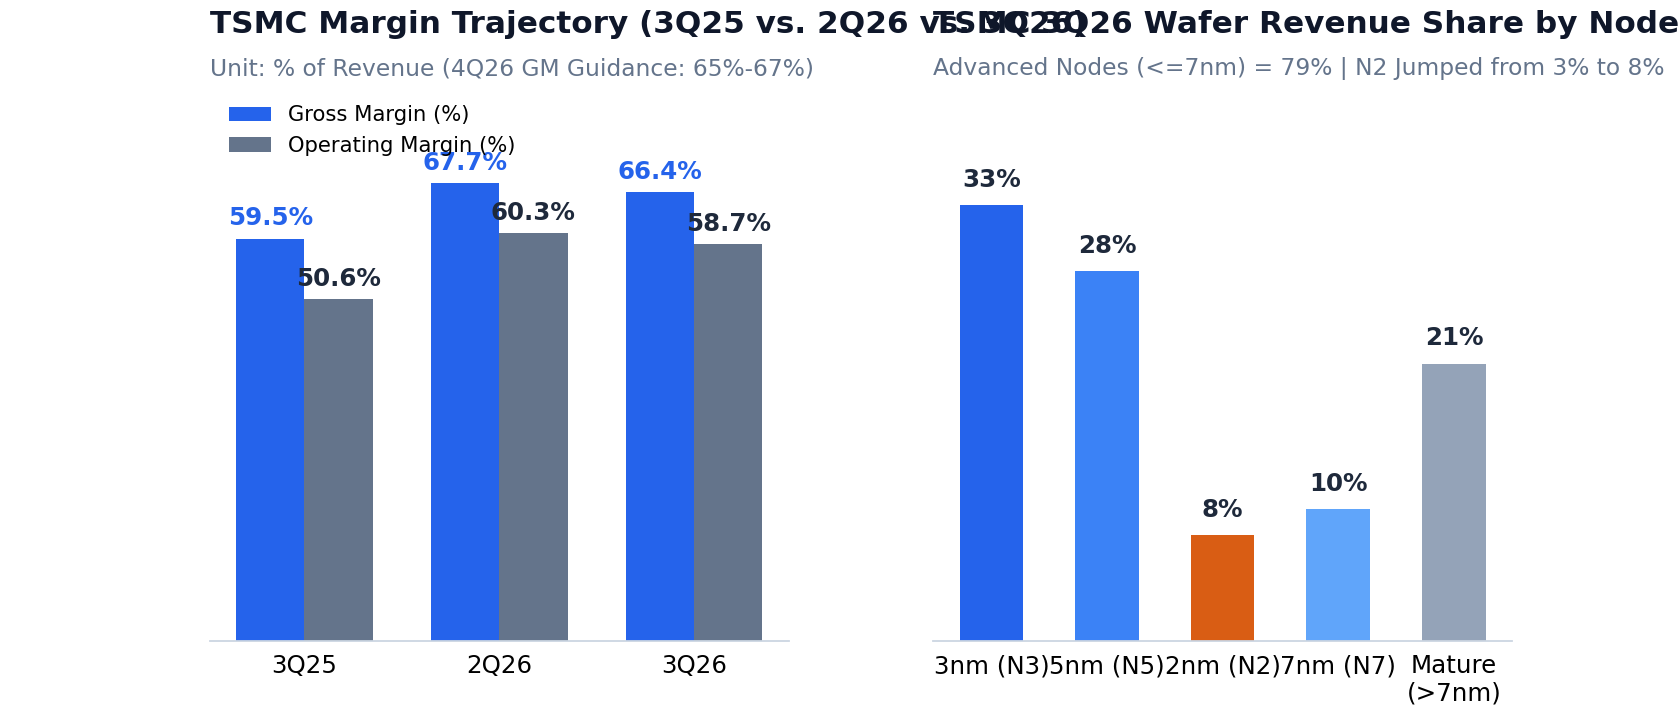
TSMC 3Q26 Margin Progression & Wafer Revenue Share by Node
Gross margin (66.4%) and operating margin (58.7%) across 3Q25–4Q26G, alongside 3Q26 advanced node wafer revenue share (<=7nm = 79%, with N2 jumping from 3% to 8%).
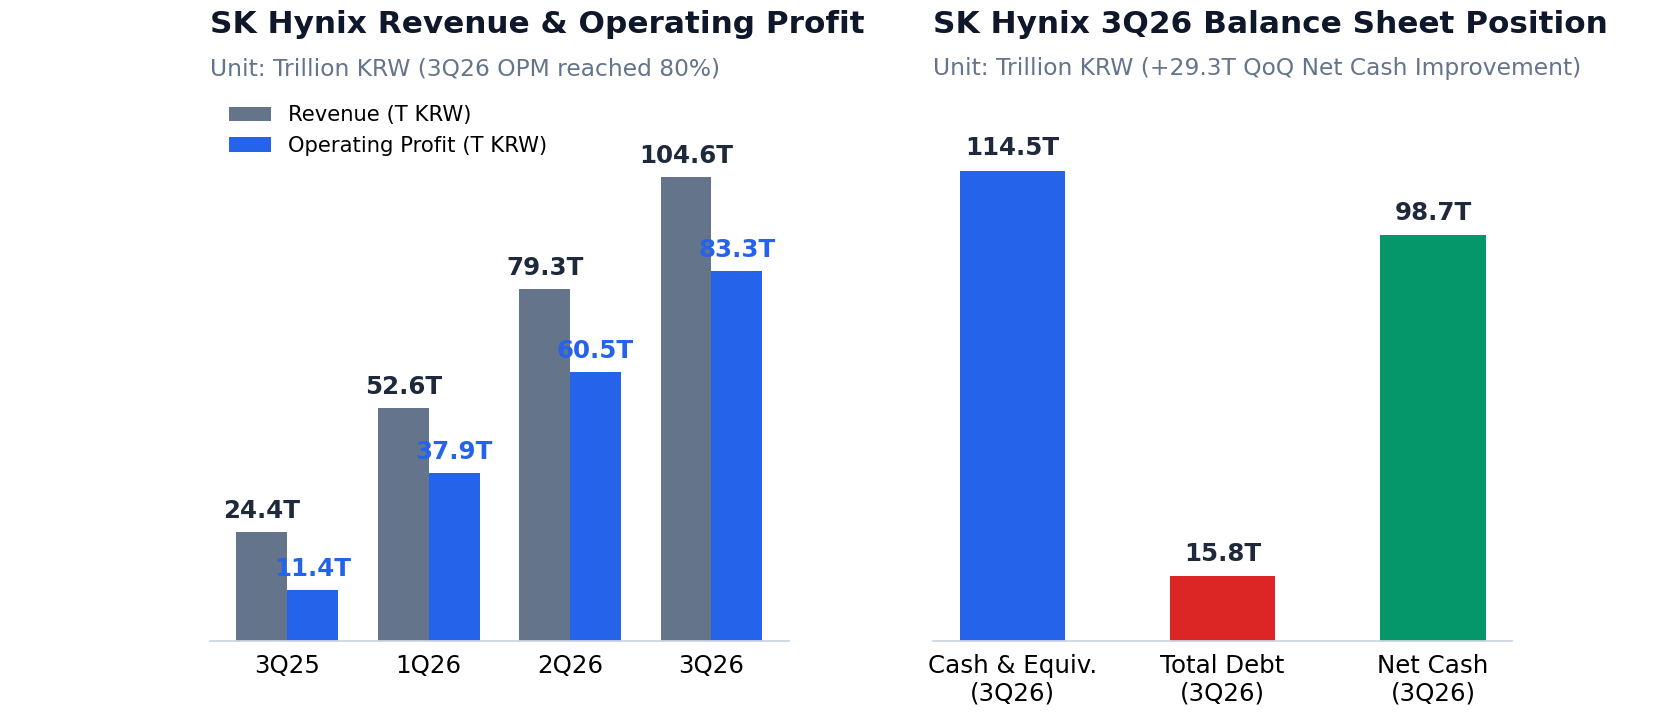
SK Hynix Quarterly Revenue, 80% OPM & 98.7T KRW Net Cash Position
Five-quarter operating margin expansion (47% -> 80% on 104.62T KRW revenue) and balance-sheet net cash rising +29.3T KRW QoQ to 98.7T KRW.
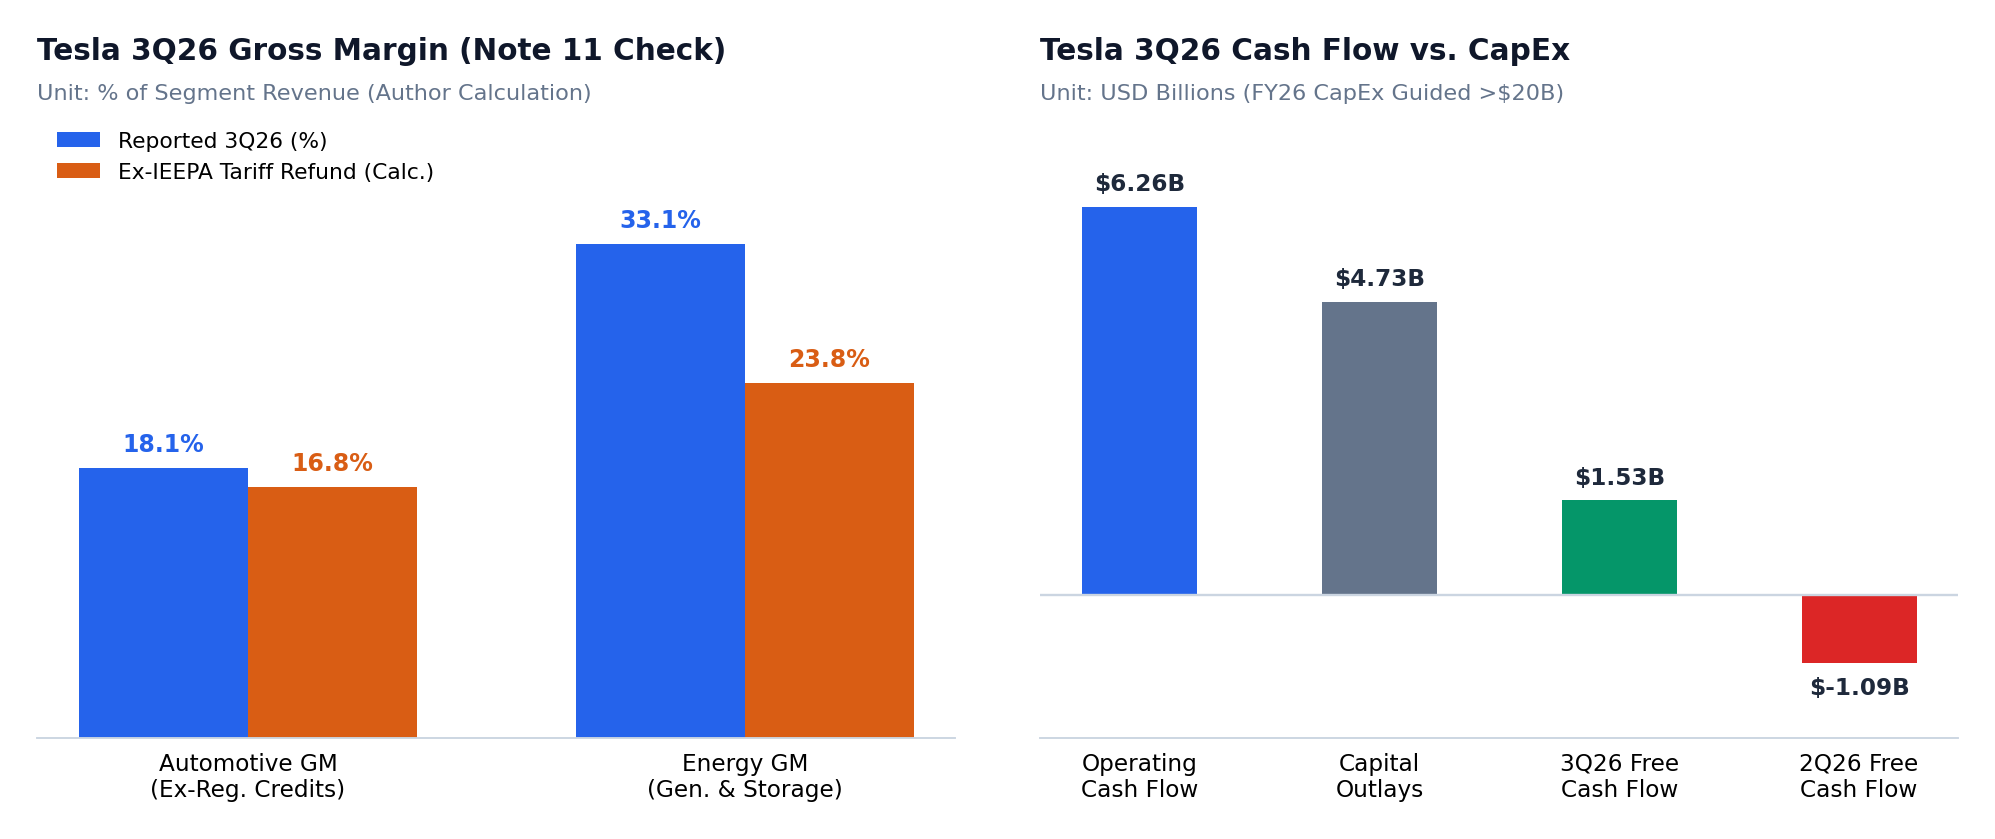
Tesla 3Q26 Reported vs. Note 11 Tariff-Refund-Adjusted Margins & Cash Flow Bridge
Comparison of reported segment gross margins vs. Note 11 IEEPA tariff refund reversals (~16.8% Auto ex-credit, ~23.8% Energy) and the GAAP OP ($718M) to OCF ($6.263B) and FCF (+$1.531B) bridge.
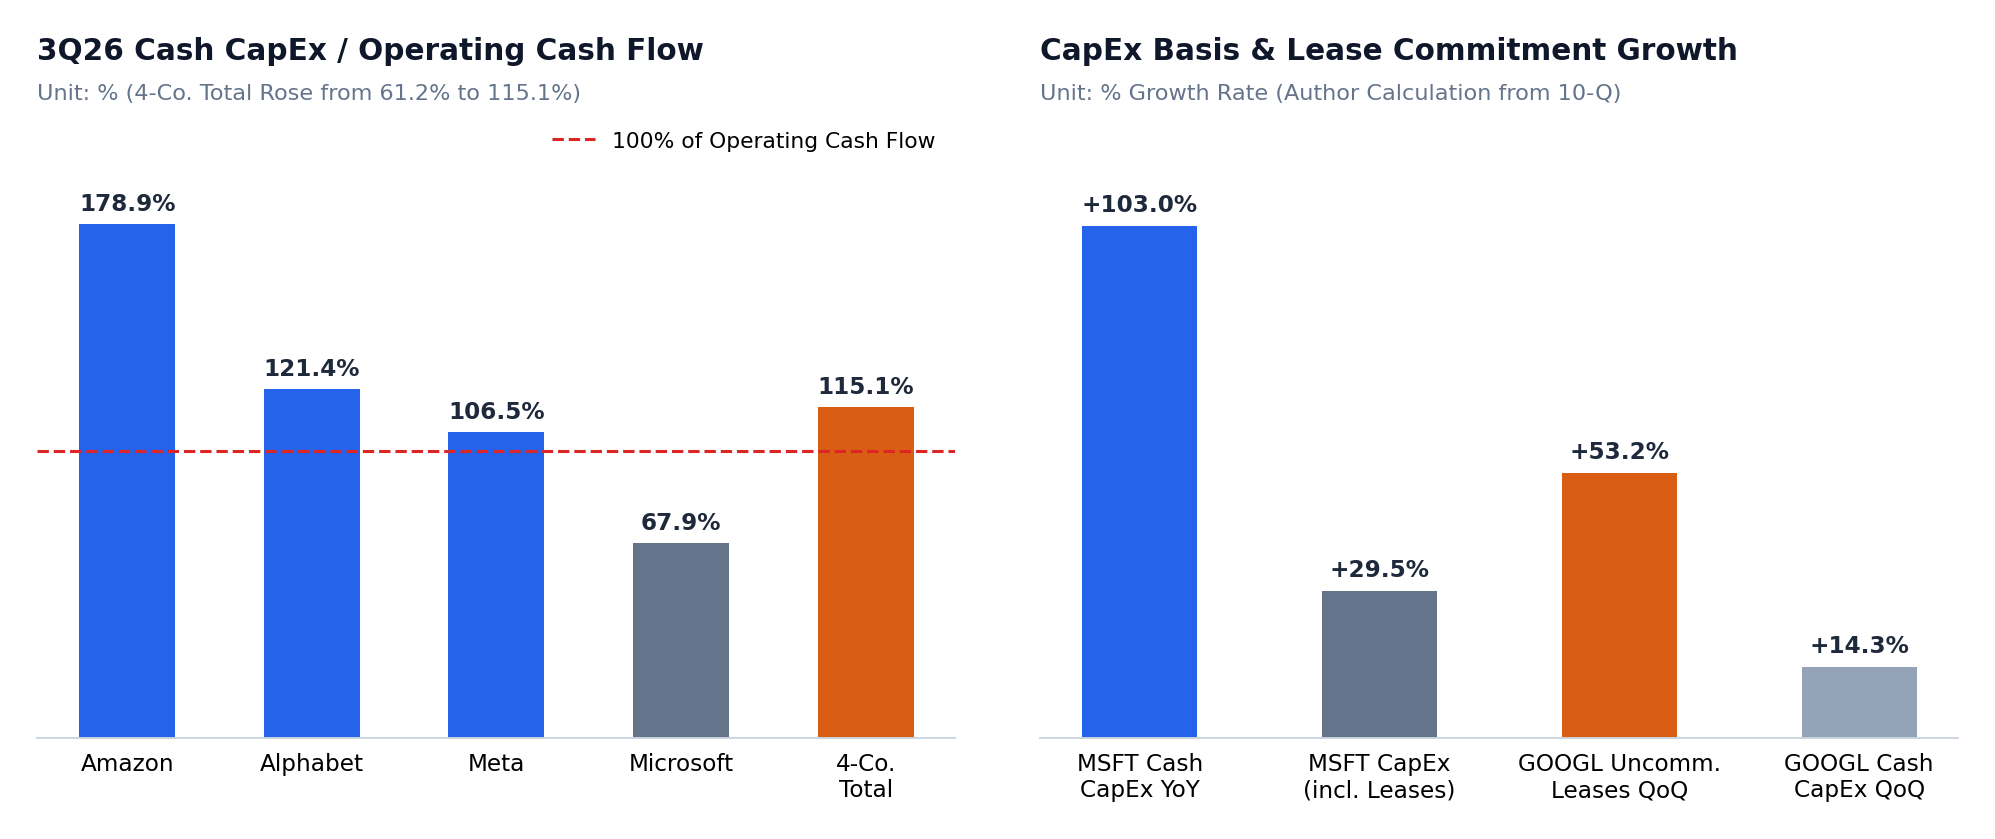
Big Tech 3Q26 Cash CapEx/OCF Ratio (115.1%) & Lease Accounting Comparison
Company-by-company 3Q26 CapEx/OCF (AMZN 178.9%, GOOGL 121.4%, META 106.5%, MSFT 67.9%) and MSFT cash vs. finance-lease basis alongside GOOGL +53.2% QoQ uncommenced lease growth.
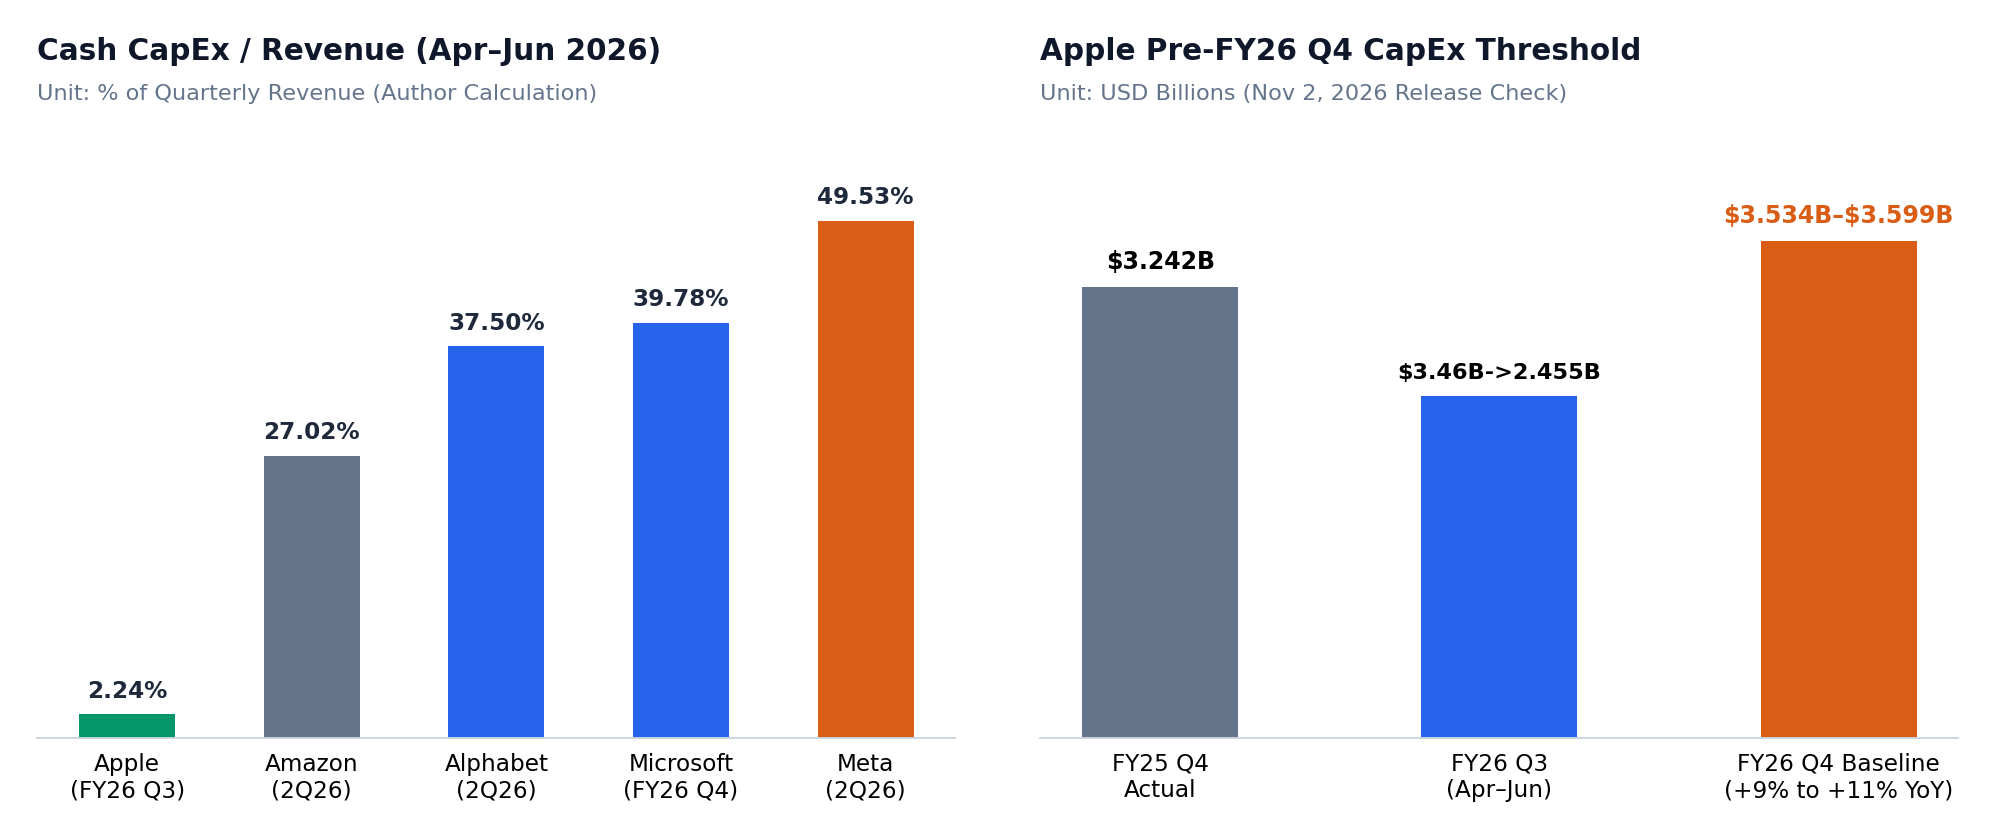
Apple vs. Big Tech Cash CapEx/Revenue (Apr–Jun 2026) & FY26 Q4 CapEx Baseline
Aligned Apr–Jun 2026 cash CapEx/Revenue (Apple 2.24% vs. peers 27.02%–49.53%) and the $3.534B–$3.599B revenue-paced FY26 Q4 CapEx verification band.
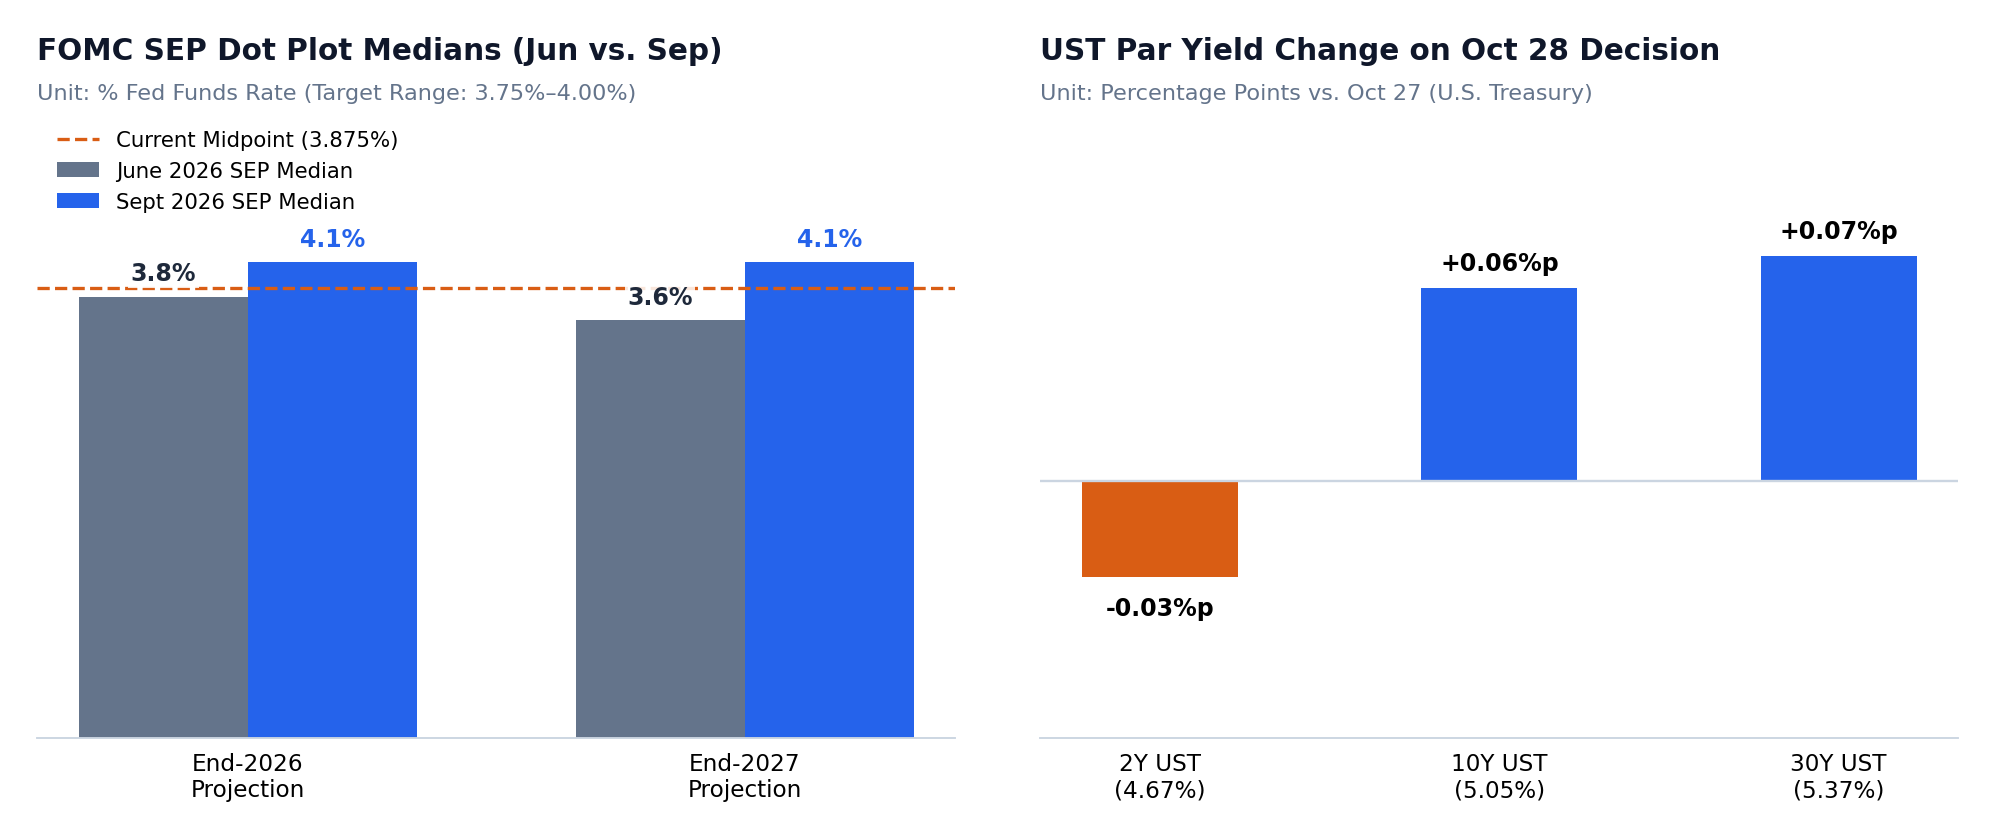
FOMC SEP Dot Plot Medians (June vs. Sept 2026) & Oct 28 Treasury Yield Curve Reaction
End-2026 and end-2027 SEP median federal funds rate projections (4.1% rounded; 4.125% unrounded 2026 median vs. 3.875% current midpoint) and Oct 28 U.S. Treasury par yield changes.