SK Hynix 3Q26 Earnings Breakdown: 104.62T KRW Revenue, 80% Operating Margin, 98.7T KRW Net Cash & ~100T KRW Shareholder Return Target
In its 3Q26 business results release on October 28, 2026 [1][2], SK Hynix reported quarterly revenue above 100 trillion KRW for the first time in company history, alongside an 80% consolidated operating margin. Below is my breakdown of the income statement, HBM4 transition schedule, net cash expansion, and the 3Q26 board resolutions on dividends and share buybacks.
- 3Q26 Earnings: Revenue reached 104.6155 trillion KRW (+32% QoQ vs. 79.3187T in 2Q26; +328% YoY vs. 24.4489T in 3Q25; ~2x vs. 52.5763T in 1Q26). Operating profit reached 83.3338 trillion KRW (+38% QoQ vs. 60.5426T; +632% YoY vs. 11.3834T), representing an 80% operating margin. Net profit was 39.7756 trillion KRW (38% net margin; +216% YoY vs. 12.5975T, -58% QoQ vs. 93.9226T in 2Q26).
- HBM4 Crossover & 2027–2028 LTAs: Following mass shipment commencement in 2Q26, HBM4 is expected to overtake HBM3E in both volume and revenue in 4Q26 as M15X capacity ramps. Long-term agreements (LTAs) covering over 50% of total 2027–2028 production capacity have been signed with price bands linked to market conditions.
- 98.7T KRW Net Cash & FY26 Shareholder Return: Cash and cash equivalents rose to 114.5T KRW (+26.5T QoQ) against borrowings of 15.8T KRW (-2.8T QoQ), yielding 98.7T KRW in net cash (+29.3T QoQ). Management targets ~100T KRW in FY2026 shareholder returns (≥50% of FCF: ≥30T dividends and ≥60T buybacks/cancellations).
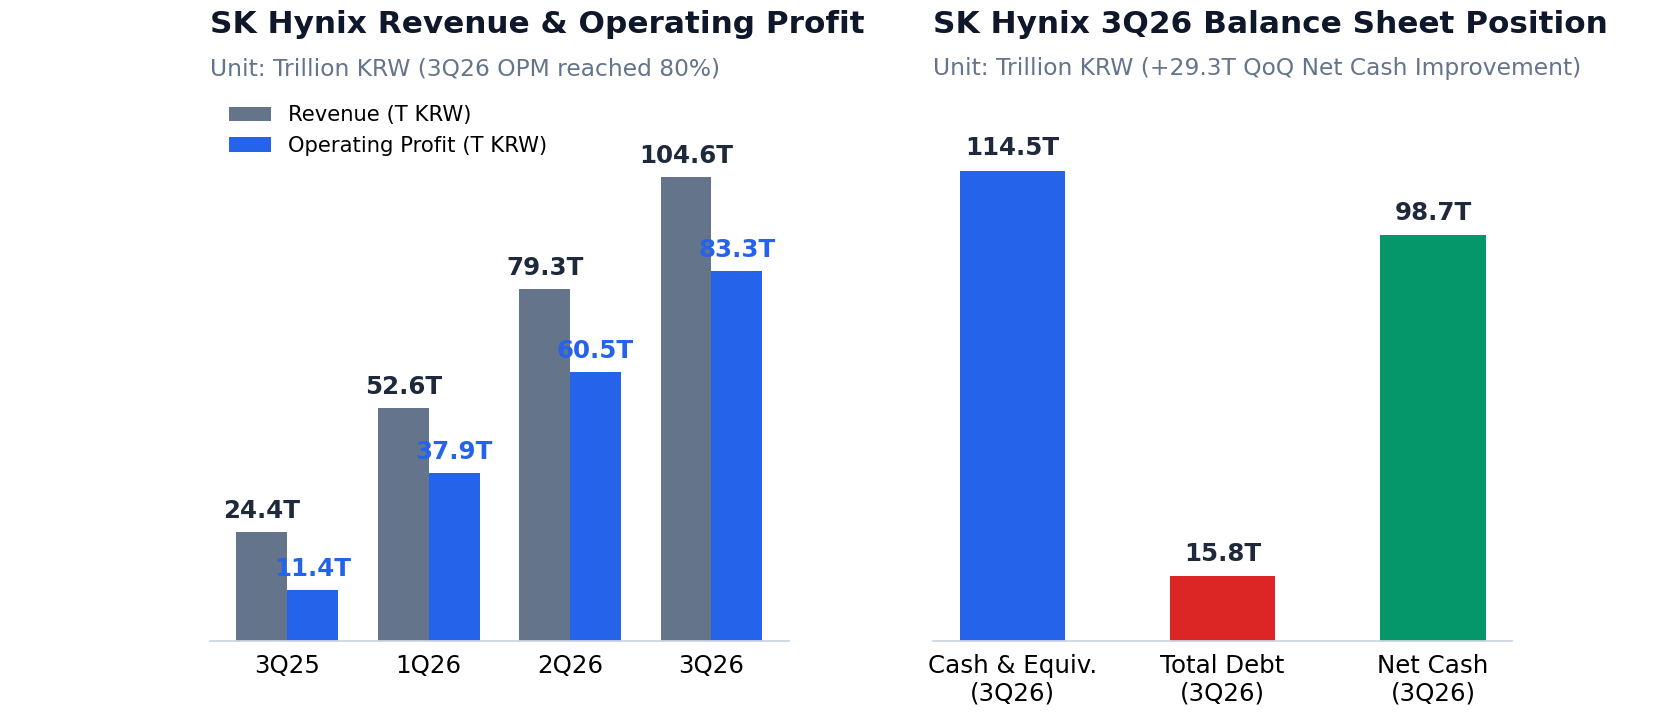
1. Quarterly Financial Progression (3Q25 – 3Q26)
Comparing SK Hynix's official quarterly disclosures across 1Q26, 2Q26, and 3Q26 [1][3][4] shows five consecutive quarters of operating margin expansion (3Q25 47% → 4Q25 58% → 1Q26 72% → 2Q26 76% → 3Q26 80%):
| Metric (Trillion KRW) | 3Q25 | 1Q26 | 2Q26 | 3Q26 Actual | QoQ / YoY |
|---|---|---|---|---|---|
| Revenue | 24.4489T | 52.5763T | 79.3187T | 104.6155T | +32% QoQ / +328% YoY |
| Operating Profit | 11.3834T | 37.8549T | 60.5426T | 83.3338T | +38% QoQ / +632% YoY |
| Operating Margin (%) | 47% | 72% | 76% | 80% | +4%p QoQ / +33%p YoY |
| Net Profit (Net Margin) | 12.5975T (52%) | — | 93.9226T (118%) | 39.7756T (38%) | -58% QoQ / +216% YoY |
Note the divergence between operating profit (+38% QoQ to 83.3338T KRW) and net profit (-58% QoQ to 39.7756T KRW): 2Q26 net profit (93.9226T KRW) had exceeded operating profit due to non-operating gains, whereas 3Q26 normalized back below operating profit after tax and non-operating items [1][3].
2. HBM4 Crossover, Server Memory Demand & 2027–2028 LTAs
SK Hynix began mass shipments of HBM4 in 2Q26, is maximizing M15X fab capacity through year-end, and expects HBM4 to surpass HBM3E in both shipment volume and revenue in 4Q26 [1][2]. Demand for 321-layer TLC enterprise SSDs (eSSD) and high-density server DDR5 modules also remained robust. Crucially, the company stated that it has secured long-term agreements (LTAs) covering more than 50% of its total production capacity for 2027–2028, structured with price bands that reflect market conditions. Meanwhile, Yongin Phase 1 cleanroom operations are scheduled to begin in 2027, which will increase 2027 CapEx relative to 2026.
3. Net Cash of 98.7T KRW & 3Q26 Board Shareholder Return Resolutions
At the end of 3Q26, cash and cash equivalents stood at 114.5 trillion KRW (+26.5T KRW QoQ from 88.0T KRW in 2Q26), while total borrowings declined to 15.8 trillion KRW (-2.8T KRW QoQ from 18.6T KRW), expanding net cash by 29.3T KRW in a single quarter to 98.7 trillion KRW [1]. For FY2026 as a whole, SK Hynix targets returning at least 50% of free cash flow—roughly 100 trillion KRW in total (≥30T KRW in cash dividends and ≥60T KRW in share buybacks/cancellations, including the 40T KRW buyback announced in August and completed the week prior to earnings). Specifically in 3Q26, the Board resolved:
- 14 Trillion KRW Cash Dividend (20,000 KRW per share): Comprising a 10,000 KRW/share quarterly dividend plus a 10,000 KRW/share special dividend funded by Kioxia investment returns.
- 20 Trillion KRW Share Buyback: Divided strictly into 10 trillion KRW for share cancellation (counted toward the shareholder return total) and 10 trillion KRW for employee compensation (excluded from the shareholder return total).
- Solidigm IPO Review Halted: The company also announced it has halted the IPO review for its NAND subsidiary Solidigm to focus on core operational alignment [1].