TSMC 3Q26 Earnings & 4Q26 Guidance Breakdown: $46.72B Revenue, 66.4% Gross Margin, 8% N2 Share & $60B-$64B CapEx
When I review TSMC's quarterly numbers, I focus less on headline revenue beats and more on three underlying operational gauges: gross margin absorption during a new node ramp, wafer revenue mix across High-Performance Computing (HPC) and leading-edge nodes, and free cash flow coverage of capital expenditures. In its 3Q26 financial release, management report, presentation, and earnings call transcript [1][2][3][4], TSMC reported 3Q26 revenue of US$46.72 billion and guided 4Q26 revenue to US$52.3B–$54.3B.
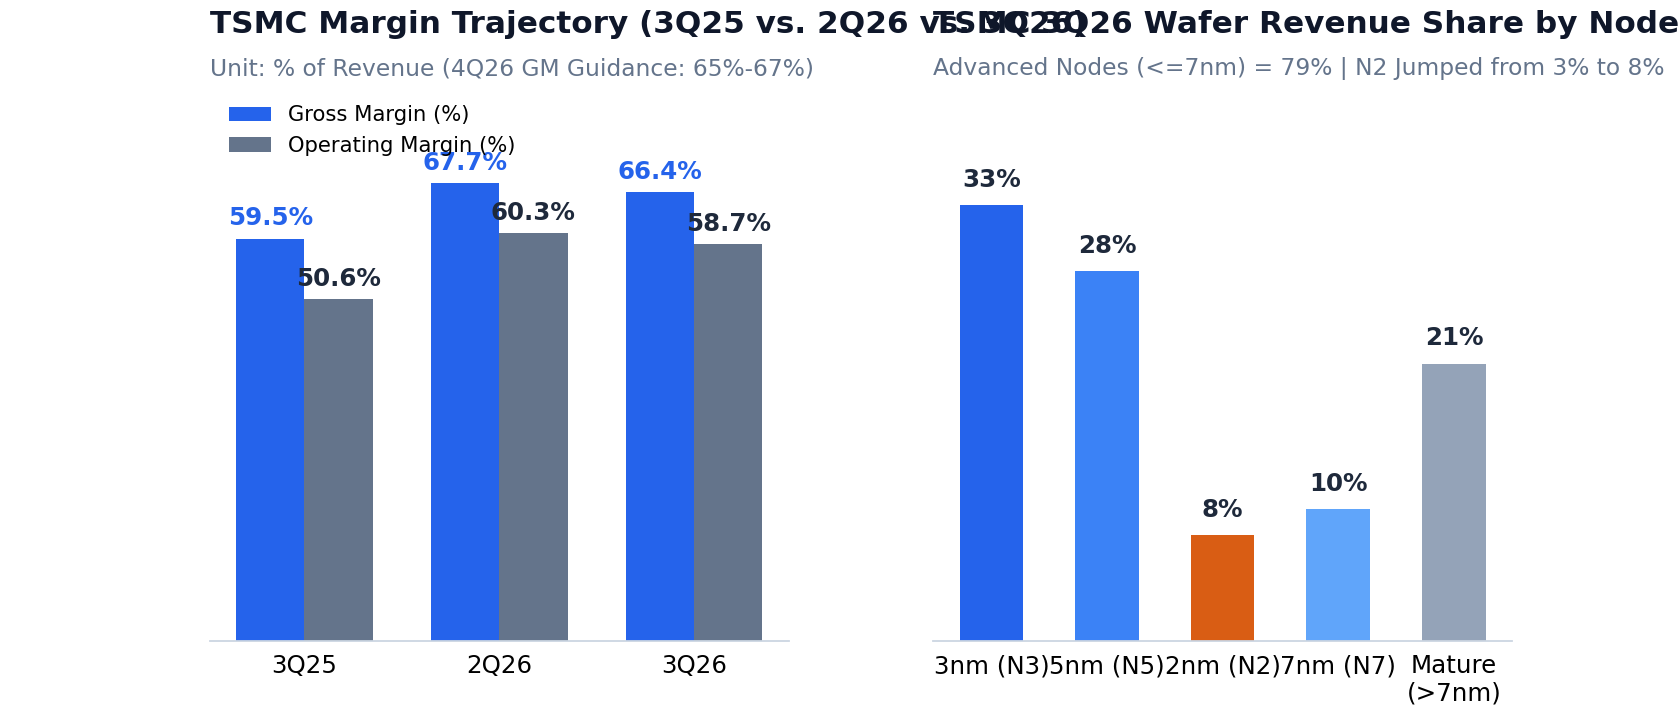
- 3Q26 Revenue & Margin: Revenue reached US$46.72B (+16.2% QoQ, +41.2% YoY), exceeding the top end of prior guidance ($45.8B); Gross Margin was 66.4% (-1.3%p QoQ from 67.7% due to initial 2nm dilution, +6.9%p YoY, inside the 65%–67% guidance band); Operating Margin was 58.7% (vs. 60.3% in 2Q26 and 50.6% in 3Q25).
- 4Q26 & Full-Year Guidance: 4Q26 revenue is guided to US$52.3B–$54.3B ($53.3B midpoint, +14% QoQ) with Gross Margin at 65%–67% (66.0% midpoint, -40bp QoQ). Full-year 2026 USD revenue growth guidance was raised from above 40% to approaching mid-40% (~44%).
- HPC, 2nm (N2) & CapEx: HPC reached 68% of revenue (+22% QoQ), advanced nodes (≤7nm) reached 79% of wafer revenue (3nm 33%, 5nm 28%, and 2nm jumped from 3% to 8%), and the 2026 CapEx budget was maintained at US$60B–$64B (with 3Q26 FCF positive at NT$476.56B).
1. 3Q26 Earnings & 4Q26 Guidance: Absorbing N2 Ramp and Overseas Fab Dilution
In 3Q26, TSMC delivered US$46.72B in revenue (+16.2% QoQ, +41.2% YoY), beating the upper bound of its prior guidance ($45.8B) [1][3]. Gross margin came in at 66.4%, down 1.3%p sequentially from 67.7% in 2Q26 as initial 2nm (N2) mass-production dilution took effect, but up 6.9%p YoY and comfortably within the 65%–67% guidance range [2].
| Metric | 3Q25 | 2Q26 | 3Q26 Actual | 4Q26 Official Guidance |
|---|---|---|---|---|
| Revenue (USD) | $33.10B | $40.22B | $46.72B (+16.2% QoQ / +41.2% YoY) | $52.3B – $54.3B ($53.3B mid, +14% QoQ) |
| Gross Margin (%) | 59.5% | 67.7% | 66.4% (-1.3%p QoQ / +6.9%p YoY) | 65.0% – 67.0% (66.0% mid, -40bp QoQ) |
| Operating Margin (%) | 50.6% | 60.3% | 58.7% (vs. 60.3% in 2Q26 and 50.6% in 3Q25) | 56.0% – 58.0% |
On the 3Q26 conference call [4], management guided that overseas fab ramps will dilute gross margin by roughly 2%p in 2026 and 3–4%p in subsequent years. Even after absorbing N2 ramp dilution and overseas fab costs, TSMC expects 4Q26 gross margin to hold a 66.0% midpoint.
2. Platform & Process Node Breakdown: HPC 68%, N2 Ramps to 8%
Looking at revenue by platform and wafer revenue by node [3]:
- HPC (High-Performance Computing): Accounted for 68% of total 3Q26 revenue (up from 66% in 2Q26), growing +22% QoQ.
- Smartphone: Accounted for 21% of revenue (down from 22% in 2Q26), growing +10% QoQ.
- Advanced Nodes (≤7nm): Reached 79% of total wafer revenue—led by 3nm at 33%, 5nm at 28%, 7nm at 10%, and 2nm (N2) jumping from 3% in 2Q26 to 8% in 3Q26.
3. CapEx Budget ($60B–$64B) & Free Cash Flow Coverage
TSMC maintained its 2026 annual capital expenditure budget at US$60 billion to US$64 billion [4]. Through the first three quarters of 2026, cumulative CapEx reached US$40.64B (with US$13.84B spent in 3Q26 alone) [3]. In NTD terms, 3Q26 operating cash flow was NT$919.77B against capital expenditures of NT$443.21B, leaving positive quarterly free cash flow of NT$476.56B [2]. Management also noted that both leading-edge foundry wafer supply and CoWoS advanced packaging capacity remain tight relative to AI customer demand [4].