Big Tech 3Q26 CapEx Scorecard: $201.9B Combined Spending Exceeds Operating Cash Flow (115.1% CapEx/OCF)
For the July–September 2026 quarter (calendar 3Q26; FY27 Q1 for Microsoft), all four U.S. hyperscalers—Microsoft, Alphabet, Meta Platforms, and Amazon—have now filed their quarterly financial statements with the SEC [1][5][8][11]. When I aggregate their cash flow statements on a gross cash PP&E basis, a pivotal threshold was crossed in 3Q26: combined 4-company cash CapEx reached ~$201.9 billion (+107.6% YoY), exceeding their combined operating cash flow (115.1% CapEx/OCF, up from 61.2% in 3Q25) (Author calculation).
- $201.9B Combined 3Q26 Gross Cash CapEx (+107.6% YoY): While 4-company combined operating cash flow grew +10.4% YoY, combined gross cash PP&E CapEx more than doubled (+107.6% YoY to ~$201.9B), pushing combined CapEx/OCF from 61.2% in 3Q25 to 115.1% in 3Q26.
- 3 of 4 Hyperscalers Spent Over 100% of OCF on CapEx: On each company's cash-basis definition, 3Q26 CapEx/OCF was Amazon 178.9% (~$75.9B net CapEx), Alphabet 121.4% (~$51.4B CapEx), Meta 106.5% (~$34.9B incl. finance lease principal), and Microsoft 67.9% (~$39.4B cash PP&E CapEx).
- Share Buybacks Halted at 3 Peers & Lease Commitments Surge: Alphabet, Meta, and Amazon recorded $0 in common stock repurchases across Jan–Sep 2026 (and issued net debt), while Microsoft reduced 3Q26 buybacks by -22.5% YoY to ~$4.38B. Meanwhile, Alphabet's uncommenced lease commitments jumped +53.2% QoQ (from end-June to end-September), outpacing its +14.3% QoQ cash CapEx growth.
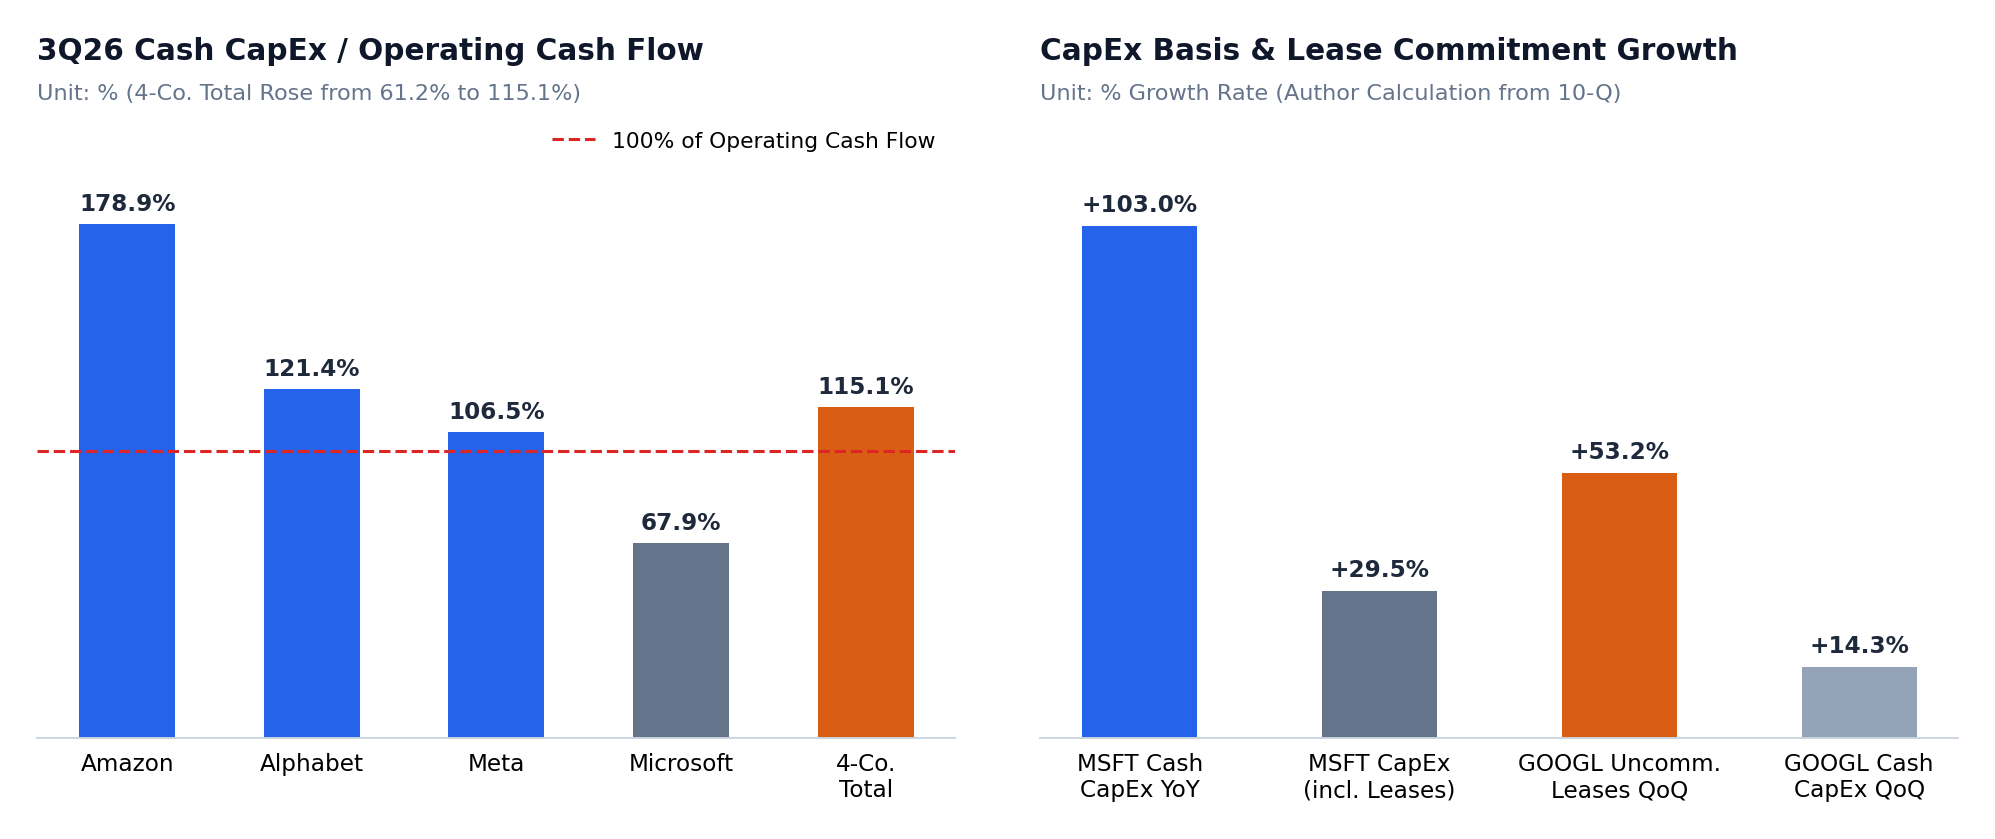
1. Company-by-Company 3Q26 Cash CapEx vs. Operating Cash Flow
Because each hyperscaler defines headline "CapEx" slightly differently in its earnings release versus its GAAP cash flow statement (especially regarding finance leases and equipment incentives), the table below reconciles each company's 3Q26 cash-basis figures and accounting disclosures (Author calculations from 3Q26 Form 10-Q / 8-K filings):
| Company (Jul–Sep 2026) | Cash-Basis CapEx | CapEx YoY | CapEx / OCF (%) | Buybacks & Key Footnote / Guidance Check |
|---|---|---|---|---|
| Microsoft (FY27 Q1) [1] | ~$39.4B (cash PP&E) | +103.0% YoY | 67.9% | Incl. finance leases, CapEx rose +29.5% YoY (matching OCF +28.7% YoY). Buybacks ~$4.38B (-22.5% YoY). |
| Alphabet (3Q26) [5] | ~$51.4B (cash PP&E) | +114.4% YoY (+14.3% QoQ) | 121.4% | Jan–Sep 2026 buybacks: $0. Uncommenced leases jumped +53.2% QoQ (June vs. Sept). |
| Meta Platforms (3Q26) [8] | ~$34.9B (incl. fin. lease principal) | +80.2% YoY | 106.5% | Jan–Sep 2026 buybacks: $0. FY26 guidance implies 4Q26 CapEx floor of ~$49.2B. |
| Amazon (3Q26) [11] | ~$75.9B (net of proceeds/incentives) | +121.7% YoY | 178.9% | Jan–Sep 2026 buybacks: $0. Full-year outlook implies 4Q26 CapEx of ~$47.8B. |
| 4-Company Combined | ~$201.9B (gross cash PP&E sum) | +107.6% YoY | 115.1% (vs. 61.2% in 3Q25) | Combined OCF grew +10.4% YoY; 3 of 4 companies funded excess CapEx via cash drawdowns/debt. |
2. Why Accounting Basis & Uncommenced Leases Matter
Two footnote checks prevent misreading the pace of hyperscaler investment:
- Microsoft's Cash vs. Finance-Lease Basis: On a pure cash PP&E outflow basis, Microsoft's 3Q26 CapEx doubled (+103.0% YoY to ~$39.4B). Including finance leases, however, total capital additions grew +29.5% YoY—closely tracking Microsoft's +28.7% YoY operating cash flow growth [1][2].
- Alphabet's Leading Indicator in Note Commitments: While Alphabet's cash CapEx rose +14.3% sequentially from 2Q26 to 3Q26, its uncommenced lease commitments jumped +53.2% sequentially between June 30 and September 30, 2026 [5][7]—signaling future data-center capacity deliveries before they hit the cash flow statement.