Four Takeaways From Samsung Electronics' 3Q26 Memory Numbers: Reading the 7.3pp Margin Gap With SK Hynix
SK Hynix's company-wide operating margin remains above Samsung's DS division; the gap narrowed from 25.4pp to 5.8pp in 1Q26 before widening for two consecutive quarters to 7.3pp in 3Q26.
As of 2026.10.30 (Source: Samsung Electronics & SK Hynix DART Fair Disclosures and 3Q26 IR Presentations) · Growth rates, ratios, and baselines not printed directly in the primary releases were calculated by me from the disclosed financial statements and are marked (Calc.) in the tables.
Following up on my SK Hynix third-quarter note, I placed Samsung Electronics' 3Q26 numbers on the same analytical frame. Note the scope difference upfront: the comparison pairs SK Hynix's consolidated company-wide operating margin against the operating margin of Samsung's Device Solutions (DS) semiconductor division, which are not identical business scopes. Here, percentage points (pp) denote the simple arithmetic difference between the two margins. Below I also record two falsifiable hypotheses along with the exact evidence that would prove them wrong.
Samsung's October 29 DART filing is an amended preliminary earnings disclosure (amending the October 8 preliminary print) prior to completion of the external auditor's review, so final audited figures can still change [1][2]. Both companies report on a consolidated K-IFRS basis covering the identical July 1–September 30, 2026 period [1][7]. Crucially for foreign investors reading Korean filings: Samsung discloses standalone revenue for Memory, but discloses operating profit only at the broader DS division level [3], whereas SK Hynix's consolidated print includes its NAND subsidiary Solidigm [7].
| K-IFRS Filing Metric (3Q26) | Verified DART & IR Figures |
|---|---|
| Samsung Consolidated (3Q26) | Revenue 195.25T KRW, Operating Profit 107.44T KRW [1] |
| Samsung DS Division (Semiconductors) | Revenue 147.1T KRW, Operating Profit 106.5T KRW → 72.4% DS OPM (Calc.) (blends Memory + System LSI + Foundry) [3] |
| Samsung Memory Standalone | Revenue 140.7T KRW (OP undisclosed; DS OP / Memory Rev sets a 75.7% boundary, Calc.) [3] |
| SK Hynix Consolidated (3Q26) | Operating Margin 79.7% (Calc. from DART; printed as 80% in company deck) [7][8] |
| 5-Quarter OPM Gap (SK Hynix − Samsung DS) | 3Q25 25.4pp → 4Q25 21.1pp → 1Q26 5.8pp → 2Q26 6.4pp → 3Q26 7.3pp (Calc.) |
| 3Q26 CapEx (Facility Plan vs. Cash PP&E) | Samsung facility CapEx 29.0T KRW (FY26 plan 84.4T, 9M 56.9T, implied 4Q ~27.5T); Cash PP&E: Samsung 26.9T KRW vs. SK Hynix 12.67T KRW |
1. Memory Discloses Revenue Only; Profit Is Visible Only Through the DS Division
In 3Q26, Samsung Electronics reported consolidated revenue of 195.25 trillion KRW and operating profit of 107.44 trillion KRW [1]. Inside the DS division—which houses Memory alongside non-memory chip design (System LSI) and contract wafer manufacturing (Foundry)—revenue was 147.1 trillion KRW and operating profit was 106.5 trillion KRW [3]. That translates into a 72.4% operating margin for DS as a whole, but because System LSI and Foundry are mixed in, it is not a pure Memory margin.
Standalone Memory revenue was 140.7 trillion KRW, confirming that Memory accounts for the vast majority of DS revenue (though segment revenue also includes inter-segment sales to other divisions inside Samsung) [3]. Management stated that server demand pushed prices higher across all memory applications, product mix was centered on AI products amid tight supply, and HBM4 sales expanded sharply [4]. Notably, management also explained that Foundry revenue and profit improved thanks to increased sales of HBM base dies—the logic die placed at the bottom of an HBM stack—and leading-edge node orders [4]. That means HBM base-die revenue is booked in Foundry, though the filings do not disclose whether those base-die sales were external customer billings or inter-segment transfers to the Memory business. FX movements were described as unfavorable sequentially, particularly for component businesses [5].
In short, HBM is discussed qualitatively without a disclosed revenue figure, and Memory profitability is visible only through the blended DS number. Every margin comparison below therefore uses proxy metrics; if Samsung ever discloses standalone Memory operating profit or HBM revenue, this analysis will be updated.
2. Side by Side With SK Hynix: The Margin Gap Narrowed From 25.4pp to 5.8pp, Then Widened to 7.3pp
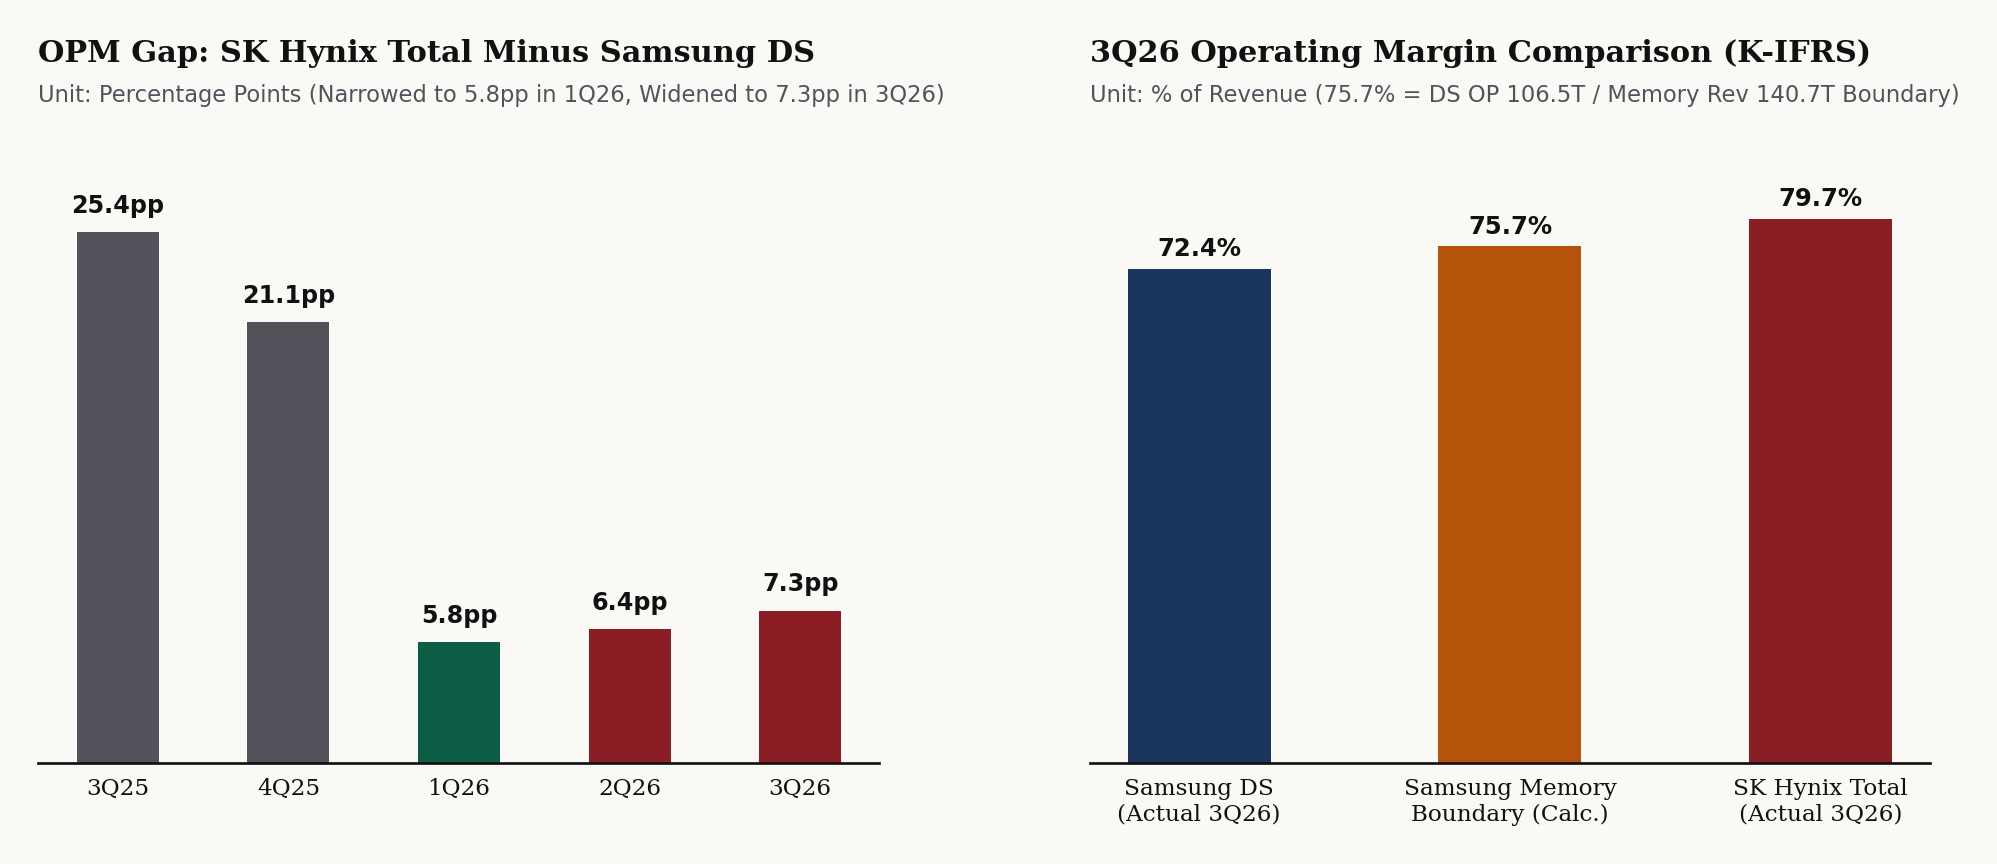
Left: 5-quarter operating margin gap (SK Hynix consolidated OPM minus Samsung DS OPM, in percentage points). Right: 3Q26 operating margin comparison showing Samsung DS (72.4%), the mathematical boundary for Samsung Memory if non-memory DS is non-negative (75.7%, Calc.), and SK Hynix consolidated (79.7%). Source: Samsung 4Q25–3Q26 IR decks & SK Hynix DART filings [3][7][10][11][13].
On the unrounded DART numbers, SK Hynix's 3Q26 consolidated operating margin was 79.7% (printed as 80% in the IR presentation) [7][8]. Because Samsung's standalone Memory operating margin cannot be observed directly, I compute its mathematical boundary: dividing total DS operating profit (106.5T KRW) by standalone Memory revenue (140.7T KRW) yields 75.7% [3]. If non-memory DS (System LSI + Foundry) was break-even or profitable in 3Q26, Samsung's standalone Memory operating margin must be 75.7% or lower—still below SK Hynix's 79.7%. Only if non-memory DS ran an operating loss would Samsung's pure Memory margin exceed 75.7% (and depending on the size of that loss, potentially close the gap with SK Hynix). Because non-memory DS profitability is undisclosed, 75.7% is a mathematical boundary rather than an estimate.
Tracking the headline proxy gap (SK Hynix consolidated OPM minus Samsung DS OPM) over the past five quarters shows a sharp convergence followed by two quarters of re-widening: 25.4pp in 3Q25 → 21.1pp in 4Q25 → 5.8pp in 1Q26 → 6.4pp in 2Q26 → 7.3pp in 3Q26 [3][7][10][11][13].
3. Two Hypotheses to Test in Future Korean Filings
- Thought 1 (HBM Share vs. Commodity DRAM Pricing): The first hypothesis is that most of the margin gap between the two companies is explained by HBM revenue share (falsified if standard commodity DRAM pricing turns out to be the larger driver). Because neither company discloses HBM revenue share, Samsung does not disclose standalone Memory OP, and HBM base-die sales sit inside Samsung Foundry with undisclosed inter-segment eliminations [3][4][8], I keep Thought 1 as an open, currently untestable hypothesis until segment disclosures expand.
- Thought 2 (Does Rising Commodity DRAM Pricing Compress the HBM Margin Lead?): The second hypothesis is that during quarters when industry-wide DRAM prices rise, the margin gap between the two companies narrows (supported if the 4Q26 gap comes in below 7.3pp during a rising-price quarter). Checking the past four quarters in which Samsung explicitly cited broad memory price increases—4Q25 [11], 1Q26 [12], 2Q26 [9][10], and 3Q26 [4]—the margin gap narrowed in two quarters (4Q25 and 1Q26) and widened in two quarters (2Q26 and 3Q26). Because the historical record is split 2-for-2 and Foundry/System LSI noise sits inside DS, I currently score the evidence as mixed and will test whether the 4Q26 gap narrows below 7.3pp.
4. Facility CapEx Plans vs. Cash Flow Statement PP&E Outlays
In Korean filings, it is essential to distinguish announced "facility investment" plans from actual cash outflows for PP&E on the cash flow statement. Samsung reported 3Q26 facility investment of 29.0 trillion KRW [4] against its full-year 2026 plan of 84.4 trillion KRW disclosed in DART [6]. Subtracting 9-month cumulative facility investment (56.9T KRW) from the 84.4T KRW annual plan leaves an implied 4Q26 balance of ~27.5 trillion KRW [4][6].
SK Hynix did not print a standalone 3Q facility CapEx figure in its press release, so the only strictly comparable metric across both companies is cash acquisition of PP&E on the statement of cash flows: in 3Q26, cash PP&E outlays were 26.9 trillion KRW at Samsung and 12.67 trillion KRW at SK Hynix [3][8]. Both companies project AI memory demand to exceed supply into 2027 (with Samsung guiding double-digit Foundry revenue growth in 4Q26 and SK Hynix guiding higher CapEx in 2027) [4][8].
Sources
- DART Samsung Electronics Preliminary 3Q26 Earnings Fair Disclosure, 2026.10.29.
- DART Samsung Electronics Amended Preliminary 3Q26 Earnings Fair Disclosure, 2026.10.29.
- Samsung Electronics 3Q26 Earnings Call IR Presentation (PDF, pp. 6–7, 13, 15), 2026.10.29.
- Samsung Global Newsroom: Samsung Electronics Announces Third Quarter 2026 Results, 2026.10.29.
- Samsung Korea Newsroom: 3Q 2026 Earnings Release, 2026.10.29.
- DART Samsung Electronics Future Business & Management Plan (2026 CapEx Guidance), 2026.10.29.
- DART SK Hynix Preliminary 3Q26 Earnings Fair Disclosure, 2026.10.28.
- SK Hynix FY2026 Q3 Earnings IR Presentation (PDF, pp. 5, 11–12, 16–17), 2026.10.28.
- Samsung Global Newsroom: Second Quarter 2026 Results, 2026.07.30.
- Samsung Electronics 2Q26 Earnings IR Presentation (PDF, p. 7), 2026.07.30.
- Samsung Electronics 4Q25 Earnings IR Presentation (PDF, p. 8), 2026.01.29.
- Samsung Electronics 1Q26 Earnings IR Presentation (PDF, p. 7), 2026.04.30.
- DART SK Hynix Preliminary 4Q25 Earnings Fair Disclosure, 2026.01.28.